
This document covers the features of the Oracle module.
1. Oracle module
The Oracle module lets you supervise and administer Oracle databases registered in the application. The features you see depend on your role:
| Role | Access |
|---|---|
oracle_user | Consultation of the reports on the authorised databases |
oracle_admin | All features + administration |
| consultation right (per database) | Read-only reports |
| DBA Dev right (per database) | Consultation + kill session and SQL fix |
| DBA right (per database) | Everything: statistics, bash_snapper, restore points, audit trail |
The three per-database rights (consultation, DBA Dev, DBA) are granted by an administrator, group by group and subgroup by subgroup: you can therefore be DBA on the development databases and consultation-only on production. The right you hold on the selected database is shown by a badge in the navigation bar.
Prerequisite: the Oracle module must be active and at least one database must be accessible to you (depending on your groups). Some features also depend on the database’s Oracle licences (Diagnostic Pack, Tuning Pack) — flagged throughout the document.
graph TD
 A[Oracle home page] --> B[Database selection]
 B --> C[Reports navigation bar]
 C --> D[Real time]
 C --> E[History]
 C --> F[Configuration]
 C --> G[Diagnostics]
 C --> H[Dashboards]
 C --> I[Generated reports]
 D --> D1[Active sessions]
 D --> D2[Locks]
 E --> E1[ASH view]
 E --> E2[ASH detail]
 F --> F1[Parameters]
 F --> F2[Tablespaces]
 F --> F3[Memory]
 F --> F4[Indicators]
 F --> F5[Alert Log]
 G --> G1[ORA-01555]
 G --> G2[ORA-04030]
 G --> G3[ORA-04031]
 G --> G4[Slowdown]
 G --> G5[sw$bash_snapper]
 H --> H1[RMAN backups]
 H --> H2[DataPump export]
 H --> H3[Licences]
 H --> H4[Scheduler]
 H --> H5[Statistics]
 I --> I1[SQL Monitor]
 I --> I2[ASH report]
 I --> I3[AWR report]
2. Selecting a database
The Oracle module’s home page lists the databases you have access to, organised by group and subgroup (dev, homol, perf, pre-prod, prod, secours).
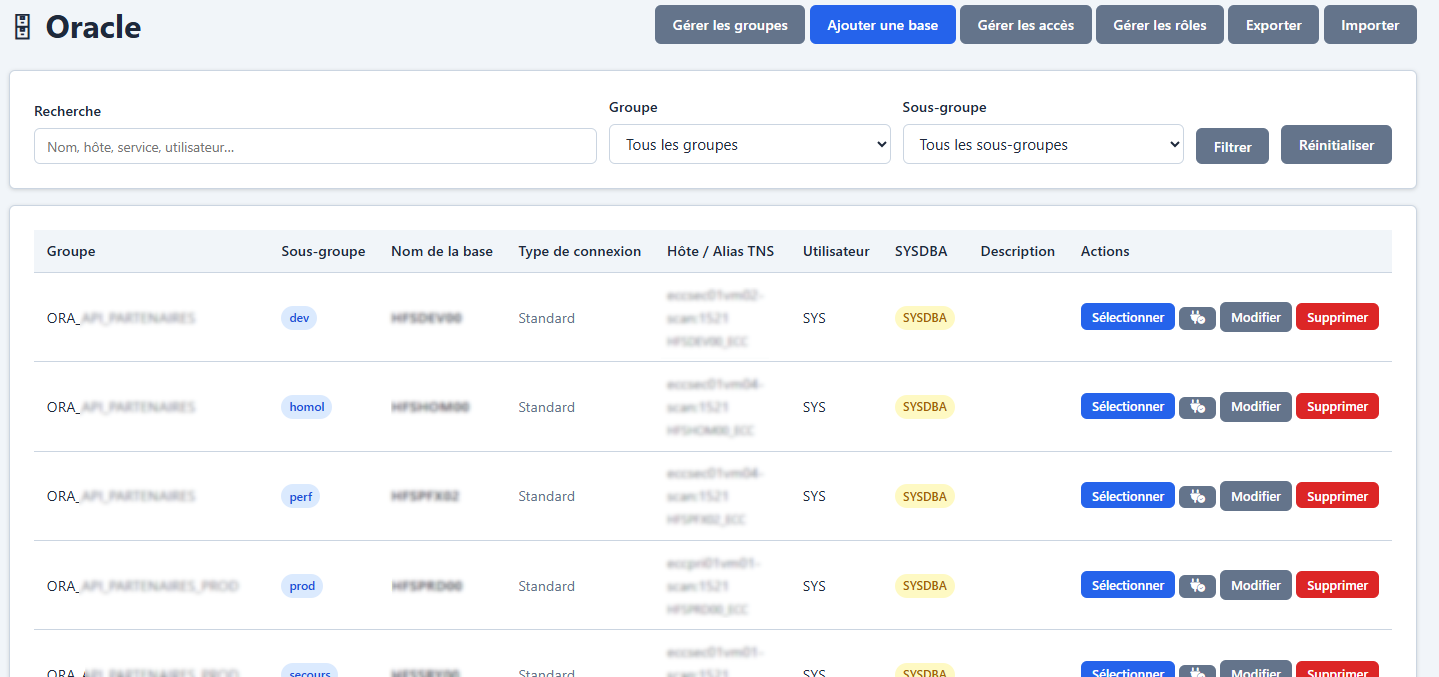
Click a database to select it. It stays active in your session until you choose another. The name of the selected database appears in the navigation bar, with a badge recalling your right level on it.
Once a database is selected, the reports are reachable from the icon side menu: one icon per report family (configuration, real time, history, generated reports, diagnostics, dashboards), each opening the list of its pages. The ☰ button, next to the application logo, fully collapses or expands this menu; your choice is remembered.
Choosing your home page
By default, selecting a database takes you to the overview. You can pick any report as the landing point:
- either from My profile, with the “Home page after selecting a database” selector;
- or directly from the report you want, by clicking the floating ☆ Set as home button at the bottom right of the screen. The star fills in when the page is your home; clicking again returns to the default.
This setting is specific to your account and applies to all databases.
Subgroups correspond to the environments:
| Subgroup | Use |
|---|---|
| dev | Development |
| homol | Acceptance |
| perf | Performance testing |
| pre-prod | Pre-production |
| prod | Production |
| secours | Disaster recovery / Data Guard |
3. Real-time reports
Active sessions
Shows the user sessions currently running on the selected database (all instances in a RAC environment).
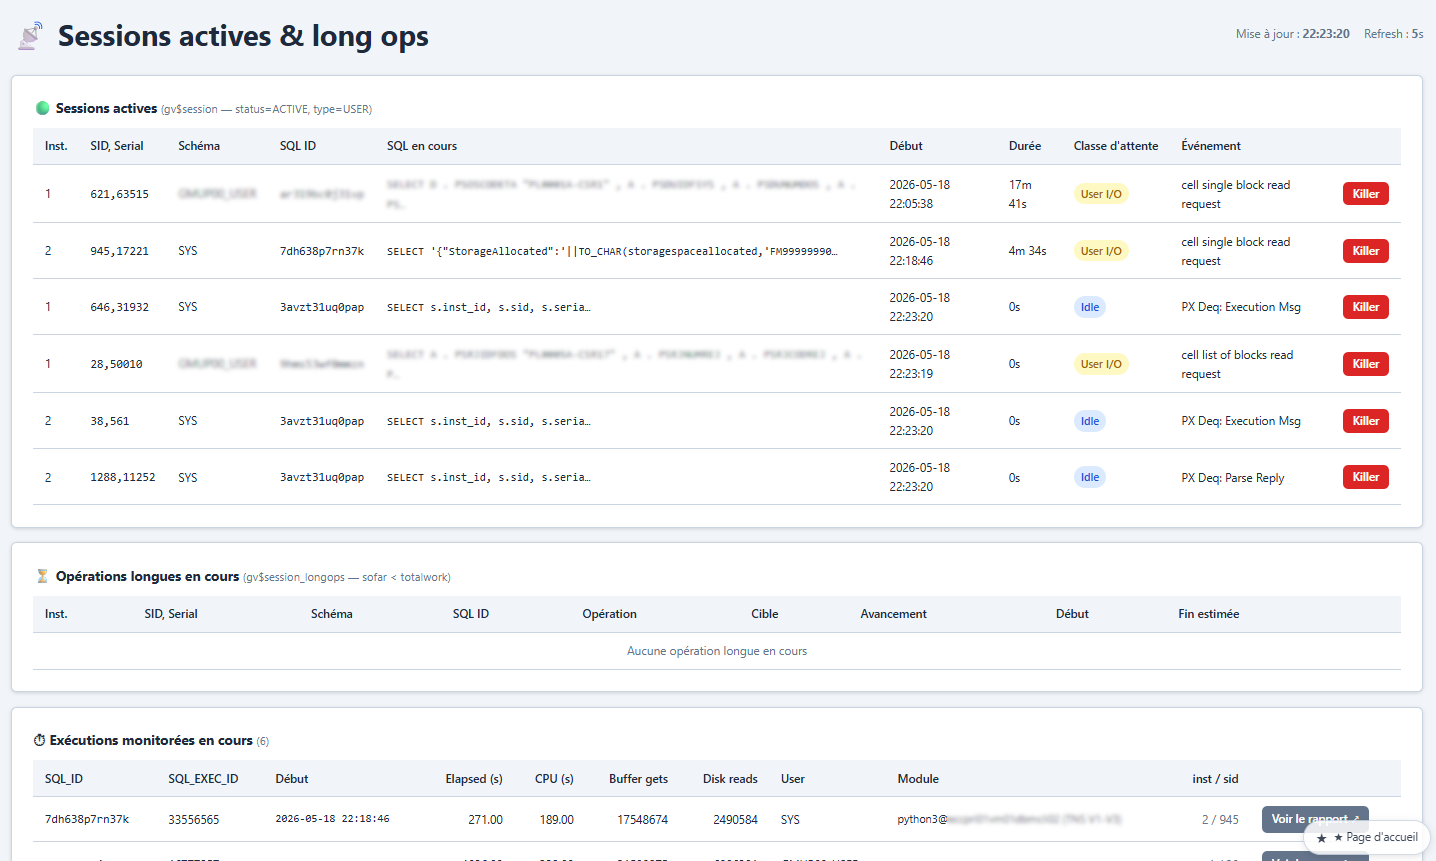
Information shown:
- Instance, SID, Serial#, User, Schema
- SQL ID, query preview (120 characters)
- Duration, wait class, wait event
- Machine, program
Automatic refresh every 10 seconds.
Kill Session (visible with the DBA right or the oracle_admin role): a red button to the right of each session. A confirmation is requested before running ALTER SYSTEM KILL SESSION.
Long operations: operations in progress (RMAN, CREATE INDEX, etc.) appear with a progress bar.
SQL Monitor (Tuning Pack licence required): executions in progress watched by Real-Time SQL Monitoring appear with a link to the detailed report.
Locks
Shows the lock tree: blocking and blocked sessions, with the full blocking chain.
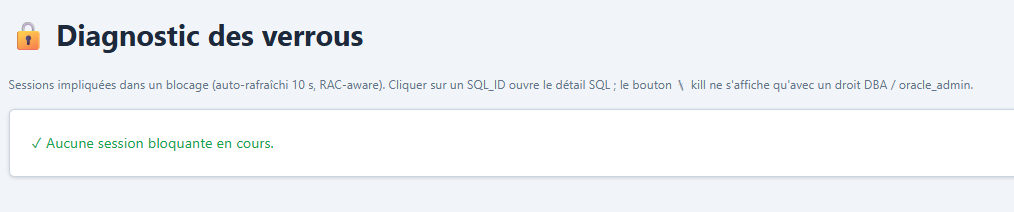
- Tree view: blocker -> blocked -> blocked (chain)
- Kill Session button on the blocking sessions (DBA right required)
- Wait information: event, resource, duration
4. History (ASH)
Licence required: Diagnostic Pack. If the database does not have this licence, the application automatically switches to the sw$bash_snapper tables (if installed — see the Diagnostics section).
ASH overview
Shows the database’s historical activity over 1, 7 or 30 days.
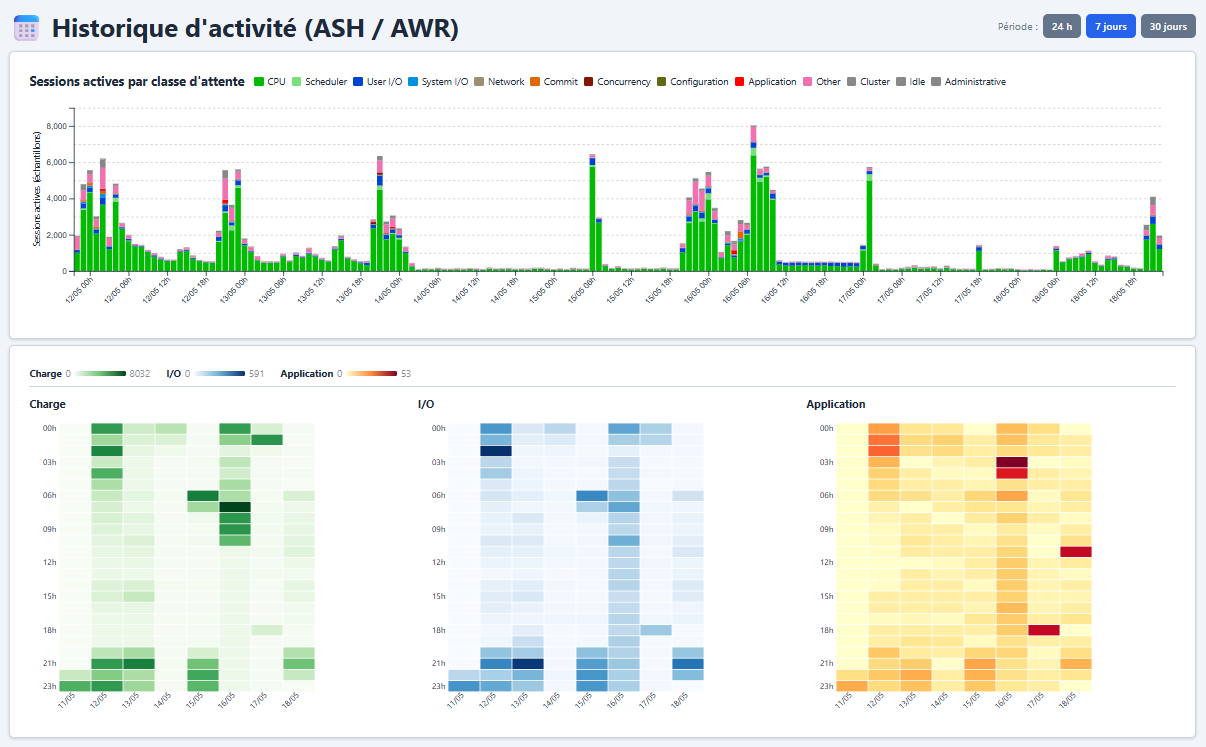
Stacked chart: hourly activity by wait class (CPU, User I/O, System I/O, Cluster, Other).
Heatmaps (day × hour matrices) — three cards:
| Heatmap | Data |
|---|---|
| Load | Total ASH activity |
| I/O | User + system I/O |
| Application | Redo switches / log switches (V$LOG_HISTORY) |
Without the Diagnostic Pack, the Load and I/O heatmaps are fed by sw$bash_snapper if it is installed (see the Diagnostics section).
Each heatmap has its own legend, with the numbered bounds of its gradient: the three colour ramps differ and each grid has its own scale top, so you should not compare a cell of one heatmap with a cell of another.
Linear or logarithmic scale
A lin / log switch follows each legend and only toggles *its* grid.
| Mode | What it does | When to prefer it |
|---|---|---|
lin | The hue is proportional to the sample count | Even load: you want to see the real proportions |
log | Details the bottom of the scale | A few peaks crush everything else |
The default is chosen grid by grid: log if the maximum is at least 5 times the median hour — many low hours and a few very large ones — lin otherwise. Without this, a monthly batch is enough to push every other hour to the bottom of the ramp, where the hues no longer differ: the grid looks uniformly pale with a single dark cell. The legend bar redraws on toggle, so it always describes the scale actually in use.
The gradient stops before the maximum when an isolated peak warrants it: the right bound then carries a + and the real maximum is recalled next to it. The hours beyond share the darkest tone; the tooltip separates them on hover.
The choice only applies to the current display: changing the window (1 / 7 / 30 d) reloads the page and lets the default decide again.
The hours shown are those of the database server, the day/hour aggregation being done in SQL. This is a deliberate difference with the PostgreSQL module, which splits in the time zone of the browsing workstation.
ASH detail
Minute-by-minute analysis with dynamic client-side filtering.
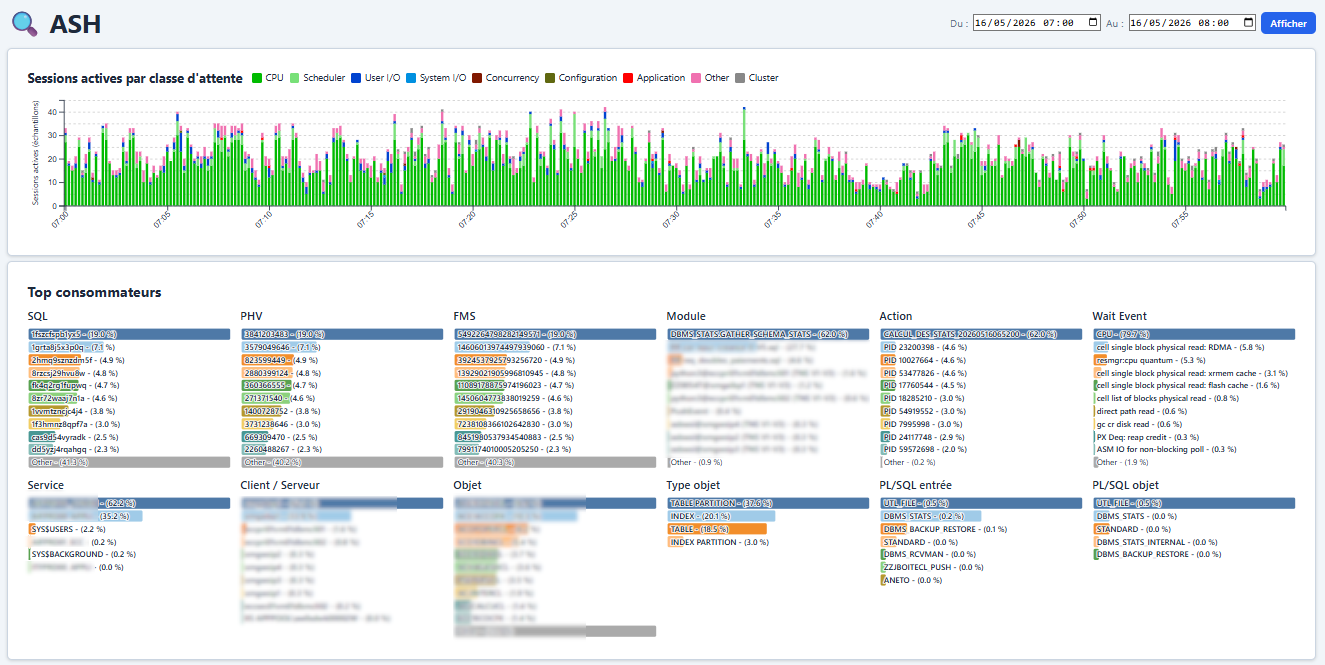
Available filters: SQL ID, wait class, event, user, session state.
Adaptive granularity:
| Range | Granularity |
|---|---|
| < 2h | 10 seconds |
| 2-12h | 1 minute |
| 12h-7d | 10 minutes |
| > 7d | 1 hour |
5. Database configuration
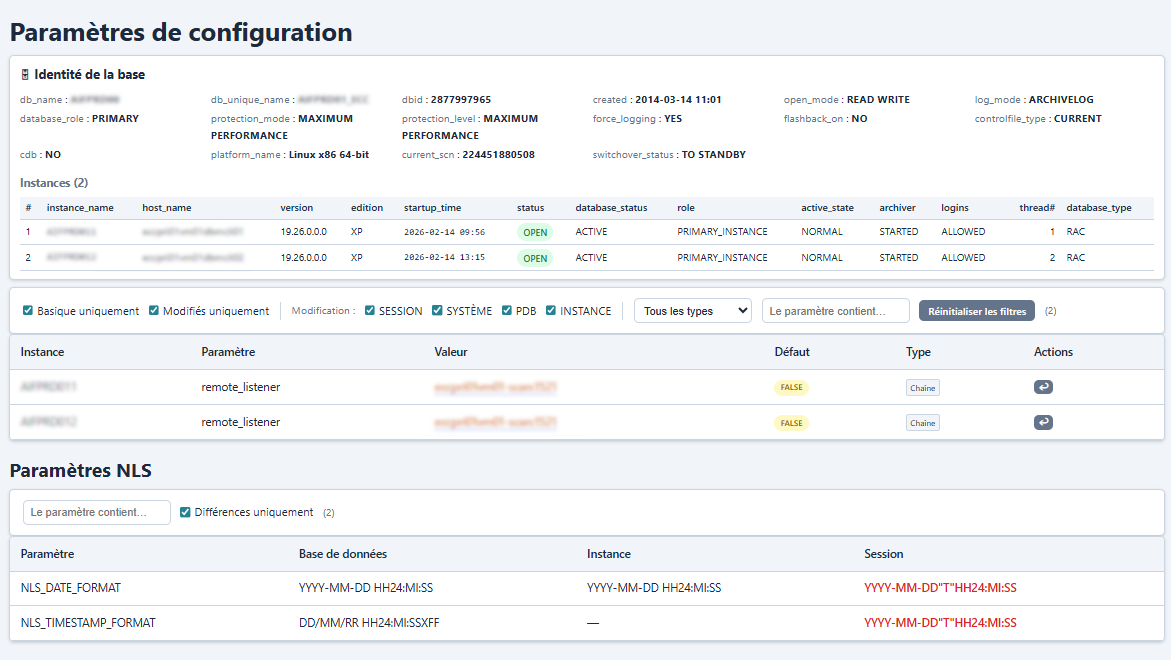
Parameters and configuration
A complete view of the database:
- V$DATABASE: identity, Data Guard mode, protection, archiving
- GV$INSTANCE: all instances (RAC), versions, startup
- GV$PARAMETER: parameters with current/default value and a modifiability indicator
- NLS: linguistic parameters (database, instance, session)
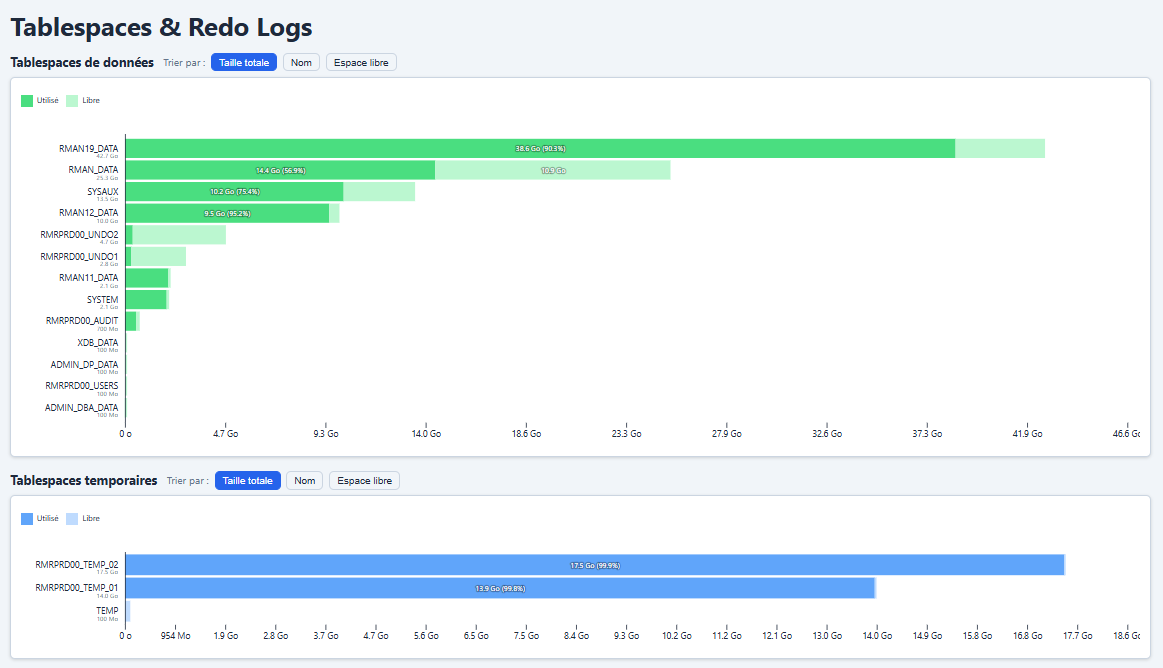
Tablespaces and Redo Logs
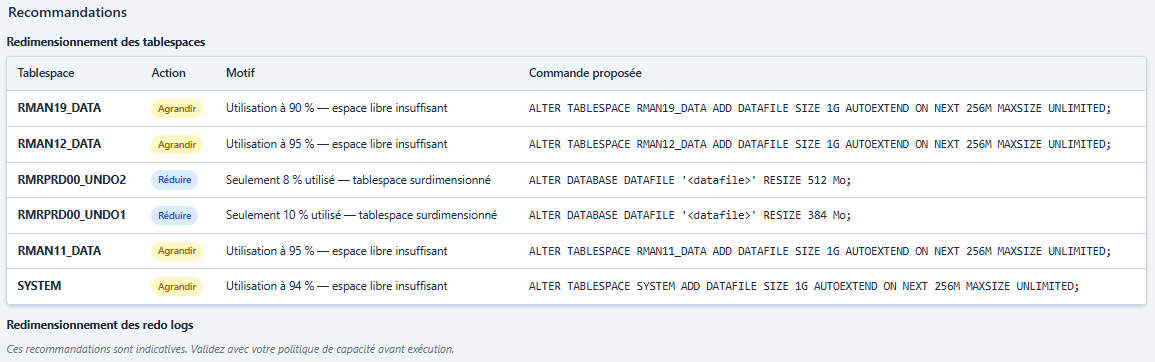
- Data tablespaces: name, size, used/free, autoextend. Encrypted (TDE) tablespaces are flagged with a padlock icon next to their name, both in the chart and in the recommendations table.
- Temporary tablespaces: size, current usage (if
V$TEMP_SPACE_HEADERis accessible). Padlock for encrypted tablespaces.
- Redo groups: thread, group, size, members, status
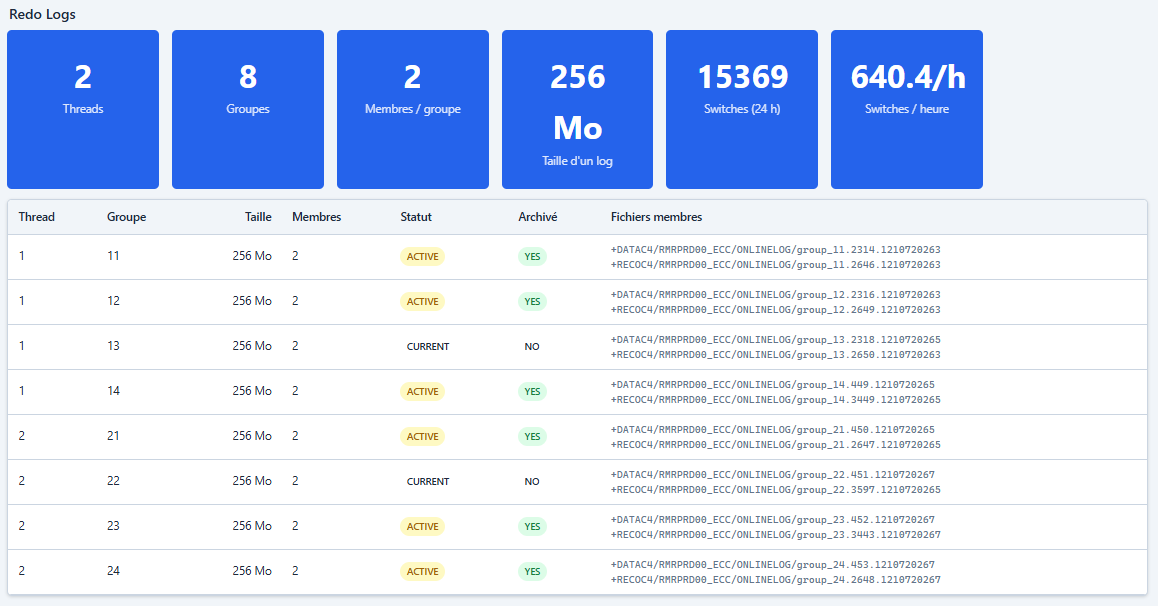
- Redo members: file paths, status
Memory
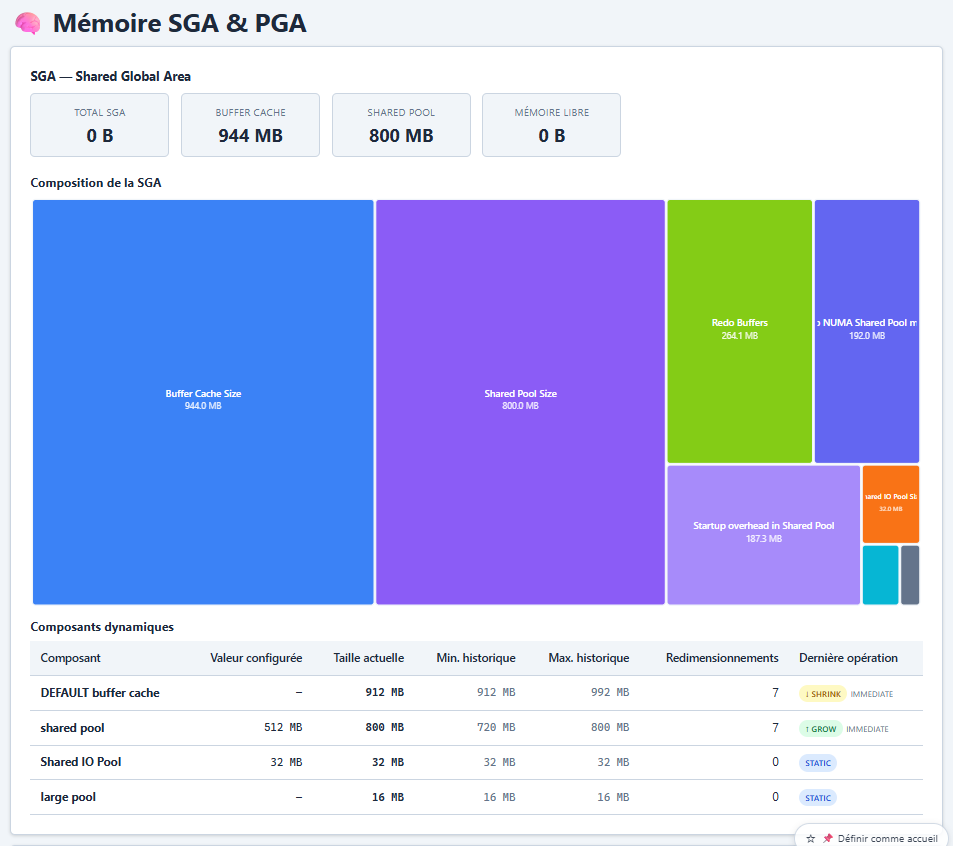
- SGA: components, sizes, resizability
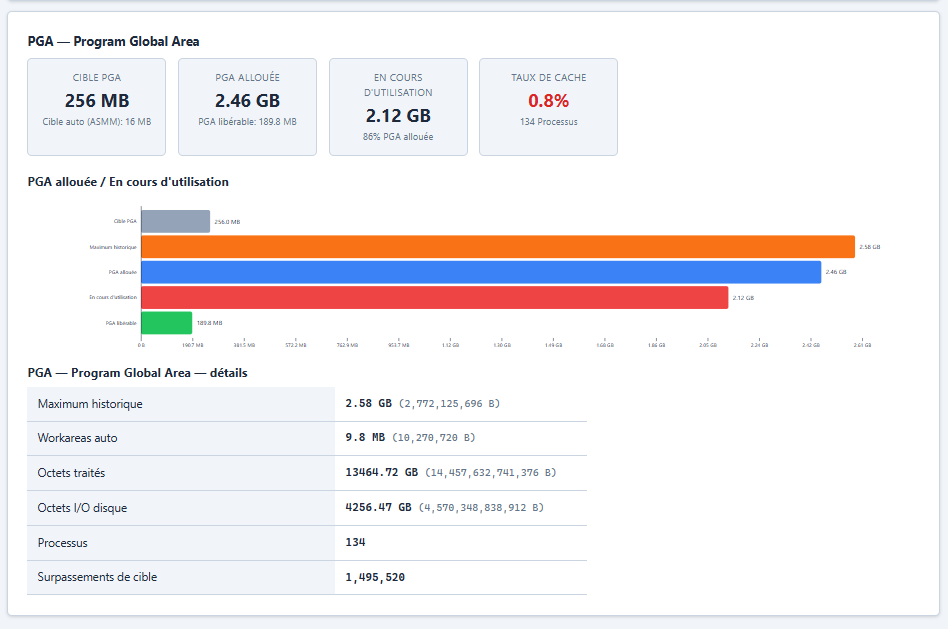
- PGA: current and maximum statistics
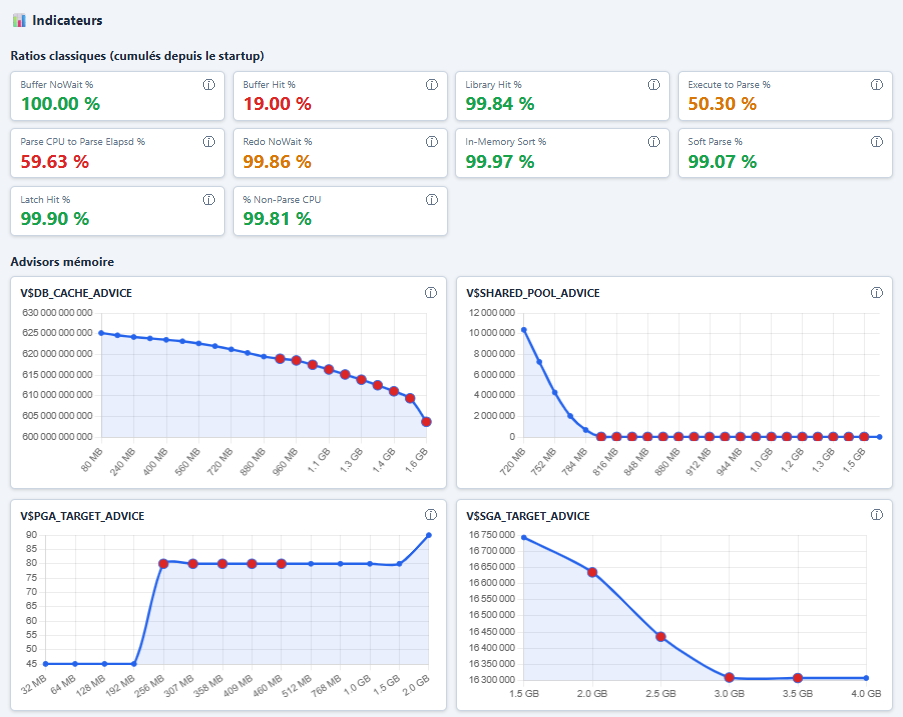
- Advisors: recommendation charts (buffer cache, shared pool, PGA target, SGA target, memory target)
Performance indicators
Ratios computed from V$SYSSTAT with health thresholds:
- Parse success ratio
- Hard parse ratio
- Library cache hit rate
- Buffer cache hit rate
- Execute-to-parse ratio
- CPU ratio
Each indicator shows a colour status (green/orange/red) with recommendations.
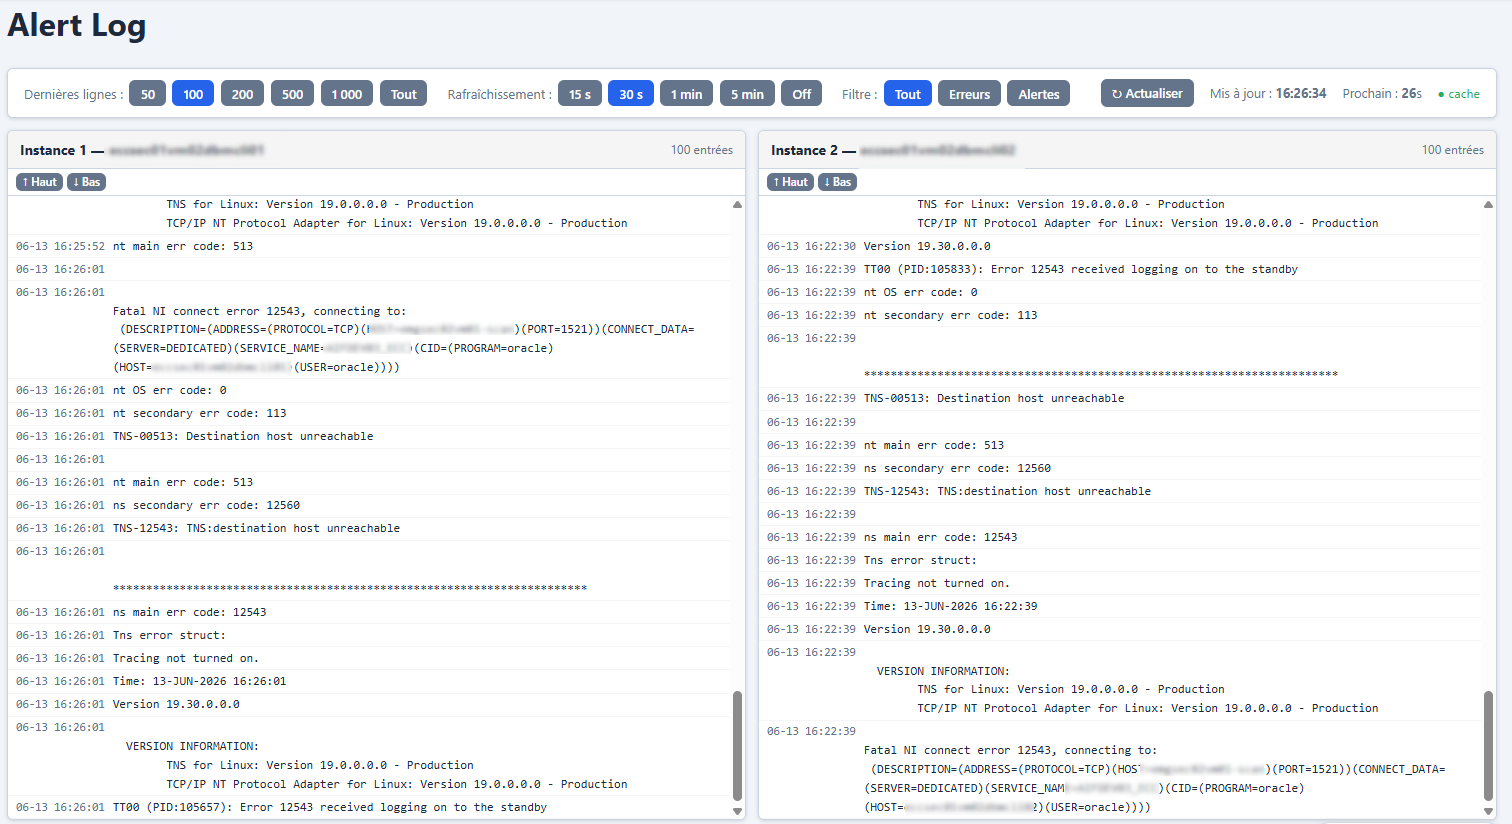
Alert Log
Shows the latest entries of the alert log (GV$DIAG_ALERT_EXT).
- Configurable limit: 50, 100, 200, 500, 1000 or all entries
- Reverse chronological order
- Severity level: ERROR, WARNING, INFO
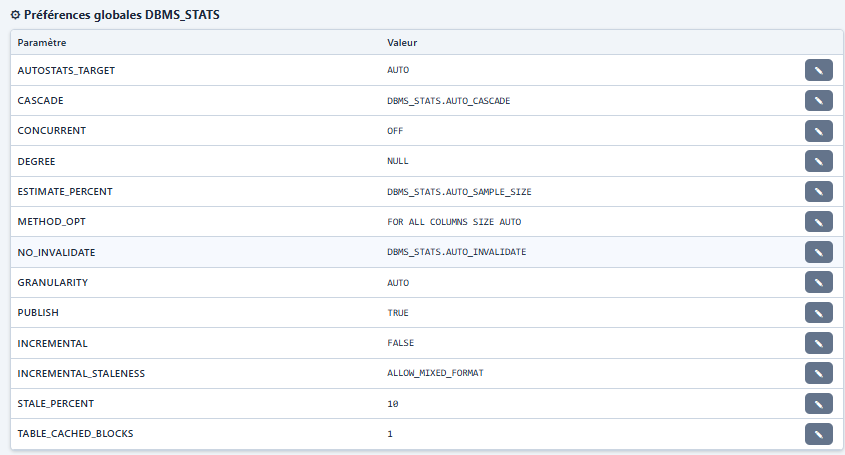
Statistics gathering (DBMS_STATS)
A Configuration menu page dedicated to managing the optimizer statistics:
- Global
DBMS_STATSpreferences (ESTIMATE_PERCENT, METHOD_OPT, CASCADE, DEGREE…) — editable with the DBA right. - Statistics per schema: freshness (last gather) and the number of tables / indexes / partitions with stale or missing statistics.
- System statistics (
SYS.AUX_STATS$) and dictionary statistics. - Automatic task “auto optimizer stats collection”: state (ENABLED/DISABLED) and maintenance window history.
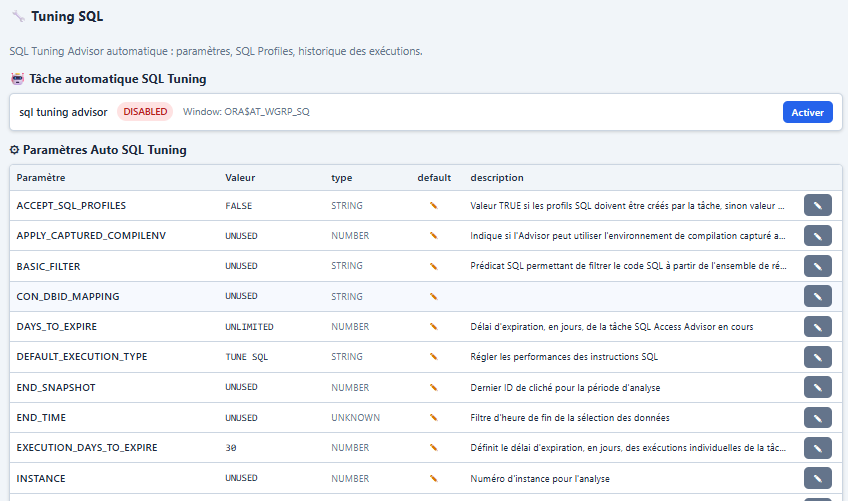
SQL Tuning (DBMS_SQLTUNE)
A Configuration menu page dedicated to the Auto SQL Tuning Advisor:
- Automatic task “sql tuning advisor”: state and history.
- Task parameters (editable with the DBA right).
- Existing SQL Profiles: name, category, status, date, SQL text.
- Latest runs of the advisor (status, errors).
Restore points
A Configuration menu page reserved for the DBA right. It lists the existing restore points (V$RESTORE_POINT) with their SCN, date, type and space used.
A prerequisites banner recalls the database state: open mode, archiving mode and Flashback. A guaranteed restore point requires ARCHIVELOG mode; if the database is not in it, the option is disabled and the reason shown.
Each row offers two actions: Delete, and Rollback, which runs nothing but shows the procedure to carry out manually — rolling back requires putting the database in MOUNT, which cannot be done from a web interface.
Audit trail
A Configuration menu page dedicated to database auditing. It automatically detects the mechanism in place and only shows what is relevant:
- Unified audit (12c and later): enabled policies, full policy catalogue, trail volume (estimated row count, oldest and most recent date).
- Traditional audit: the
audit_trailparameter value,AUD$volume, and above all what is actually audited (statement, privilege and object options).
A banner summarises the detected mode (pure unified, mixed or traditional), the version, the container (CDB/PDB) and flags the case where the audit_trail parameter differs between the instances of a RAC.
Volume: the row count is estimated from the optimizer statistics, never by a full count — a COUNT(*) on a large audit trail would be far too costly. The date of the last statistics gather is shown next to it.
With the DBA right, the page also lets you act: enable or disable policies and audit options, create or drop a unified policy, set the audit_trail parameter and purge the trail. These actions are described in the administrator guide.
6. Oracle diagnostics
ORA-01555 (Snapshot Too Old)
Analyses the potential causes of the “snapshot too old” error: undo retention, undo tablespace, long transactions, undo segments.
ORA-04030 / ORA-04031 (Memory)
- ORA-04030: diagnoses PGA memory exhaustion (top-consuming sessions, allocations, leaks)
- ORA-04031: diagnoses pressure on the SGA (shared pool fragmentation, allocations by type)
Slowdown
Performance degradation analysis by before/after comparison: wait-class distribution, execution-plan regression, configurable time windows.
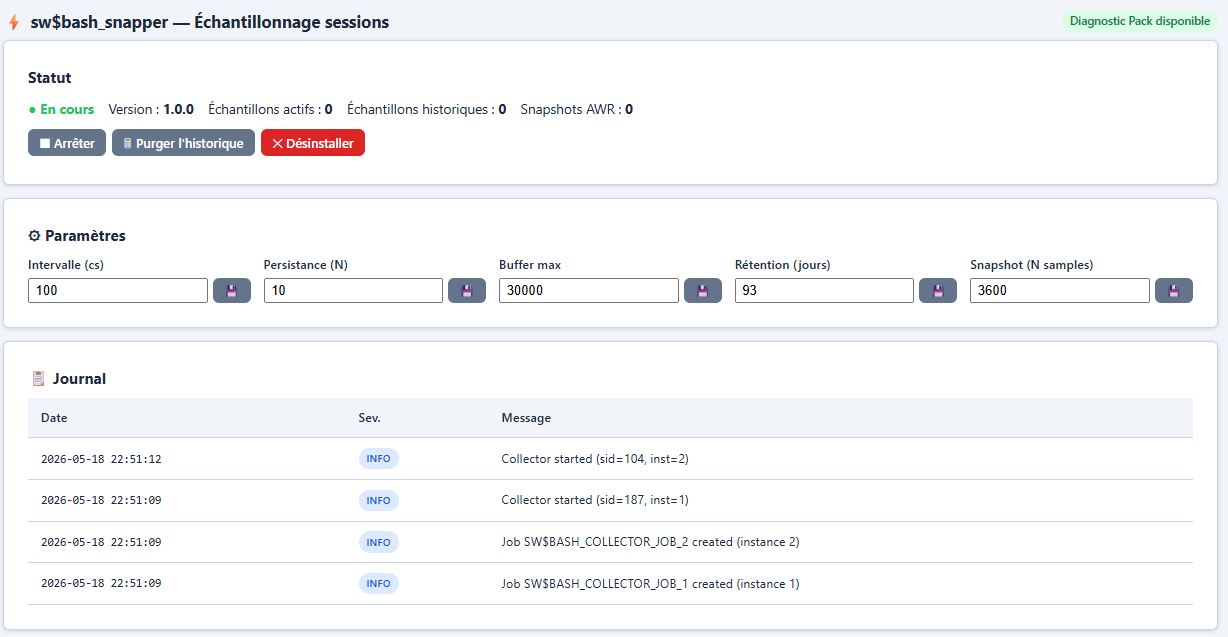
sw$bash_snapper
Only visible if the database has no Diagnostic Pack licence and you have the DBA right.
A PL/SQL package that samples session activity in an AWR-like fashion, without requiring a licence.
flowchart LR
 A[Database without\nDiag Pack licence] --> B{sw$bash_snapper\ninstalled?}
 B -- No --> C[Install button]
 C --> D[Tables + Package created]
 D --> E[Start the collector]
 B -- Yes --> F{Collector\nrunning?}
 F -- No --> E
 F -- Yes --> G[ASH data\navailable]
 G --> H[Historical reports\nuse the\nSW$BASH_* tables]
Available actions (DBA right):
| Action | Description |
|---|---|
| Install | Creates the SW$BASH_* tables and the SW$BASH_SNAPPER package |
| Start | Launches the DBMS_SCHEDULER sampling jobs (1 per RAC instance) |
| Stop | Graceful stop of the collector |
| Purge | Removes historical data older than N days |
| Uninstall | Removes all objects and jobs |
Configurable parameters:
| Parameter | Default | Description |
|---|---|---|
| sample_every_n_centiseconds | 100 (1s) | Sampling interval |
| persist_every_n_samples | 10 | Flush active -> history |
| max_entries_kept | 30,000 | Ring buffer size |
| hist_days_to_keep | 93 | History retention (days) |
| snapshot_every_n_samples | 3,600 (1h) | Frequency of the mini AWR snapshots |
7. Oracle dashboards
Backups summary
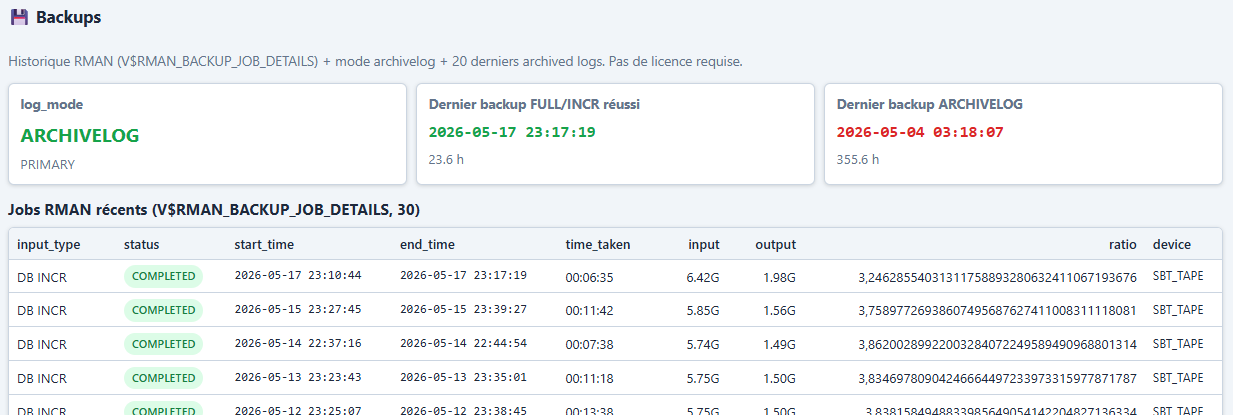
A consolidated table of the last 10 database backups (FULL or level-0 incremental backups), source V$BACKUP_SET.
- One backup = one island of backup sets whose end times are less than 2 hours apart (automatic grouping).
- Columns: type (FULL / INCR 0), end date, number of backup sets in the island.
- Period analysed: about a rolling month.
DataPump export
- Export jobs in progress (with progress)
- Last 20 completed jobs
Licences
- Available packs (Diagnostic, Tuning, Database Vault, etc.)
- Oracle edition
- Options used and compliance
Scheduler (DBMS_SCHEDULER)
- Jobs currently running
- Scheduled jobs
- Last 20 failures
Statistics
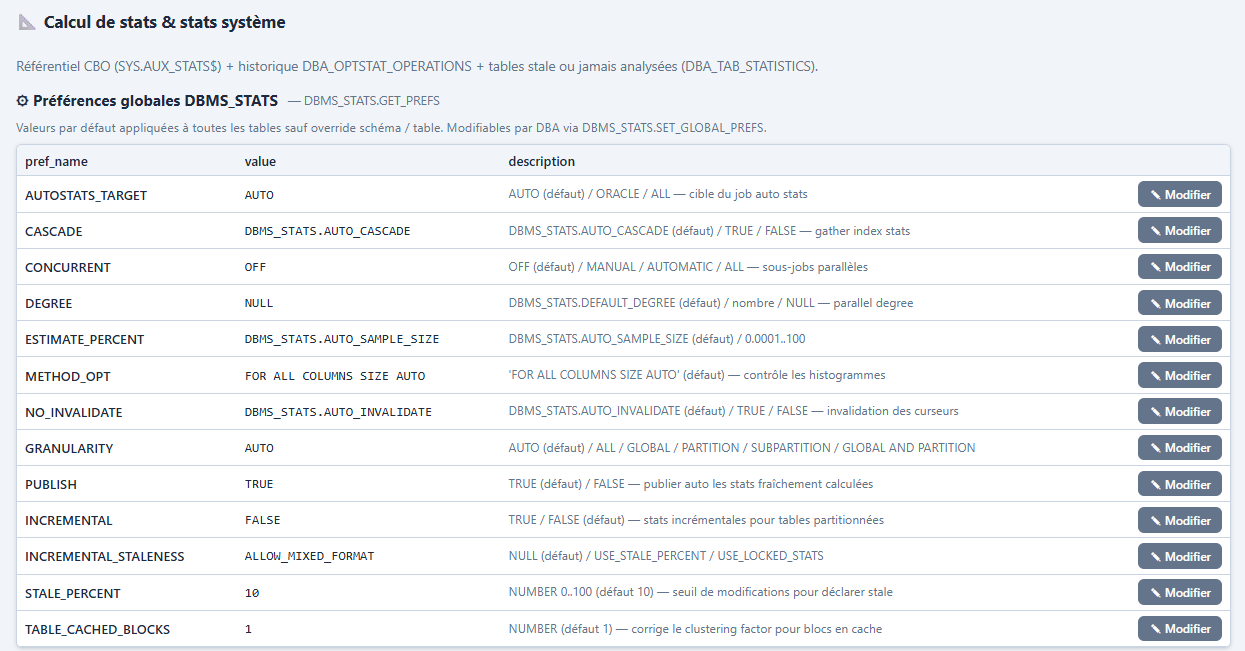
A complete view of Oracle statistics management:
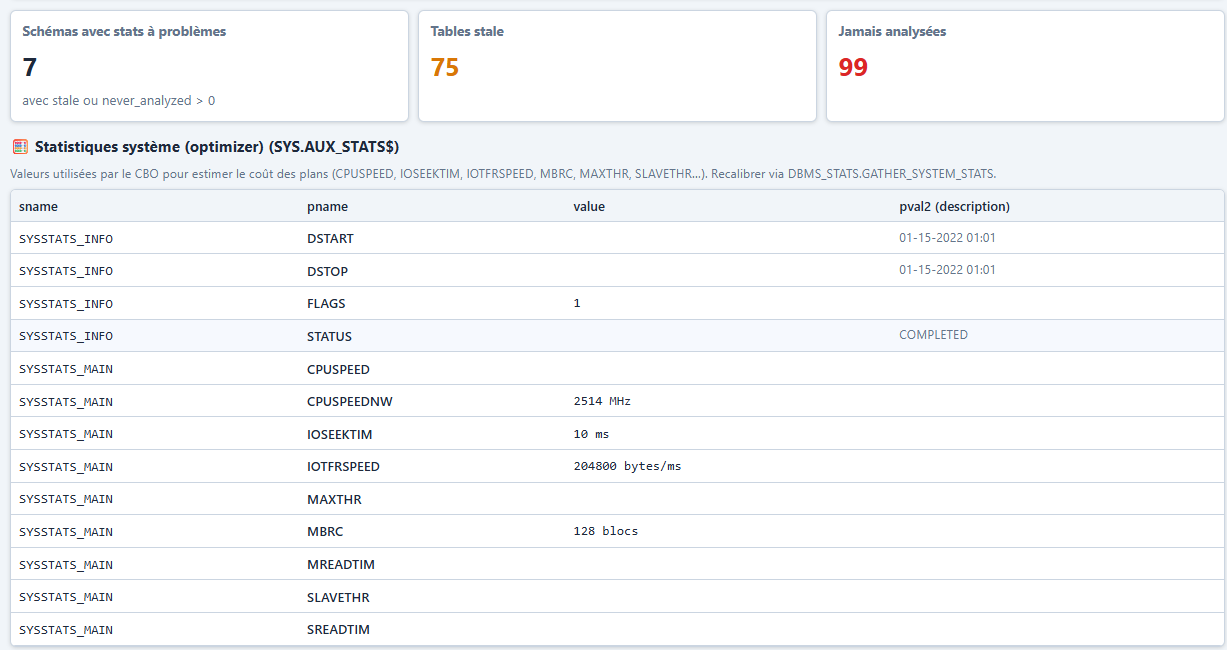
- System statistics (
SYS.AUX_STATS$): CPU speed, I/O seek time, throughput, MBRC — used by the optimizer - Global preferences: AUTO/CASCADE/CONCURRENT parameters
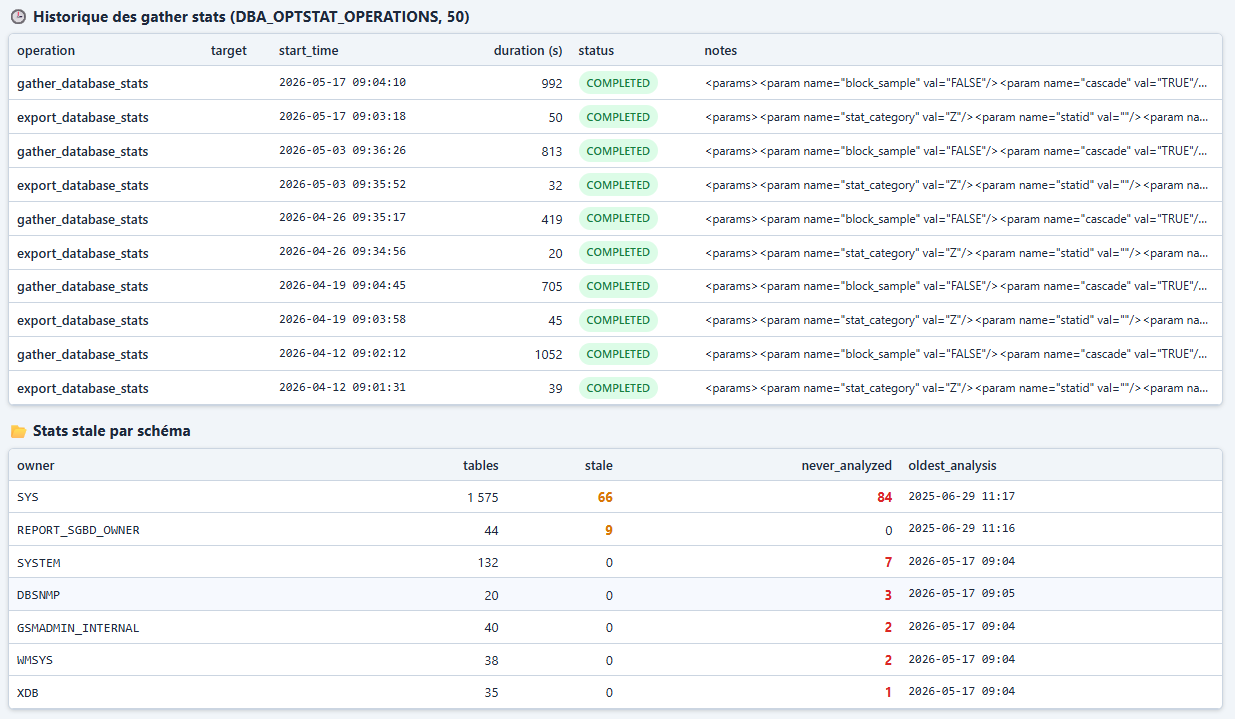
- Gather history: the last 50 GATHERs with the tables/schemas concerned
- Stale statistics: tables whose stats are obsolete or missing, aggregated by schema. Top 30 with a quick-gather button (
DBMS_STATS.GATHER_TABLE_STATSvia DBMS_SCHEDULER)
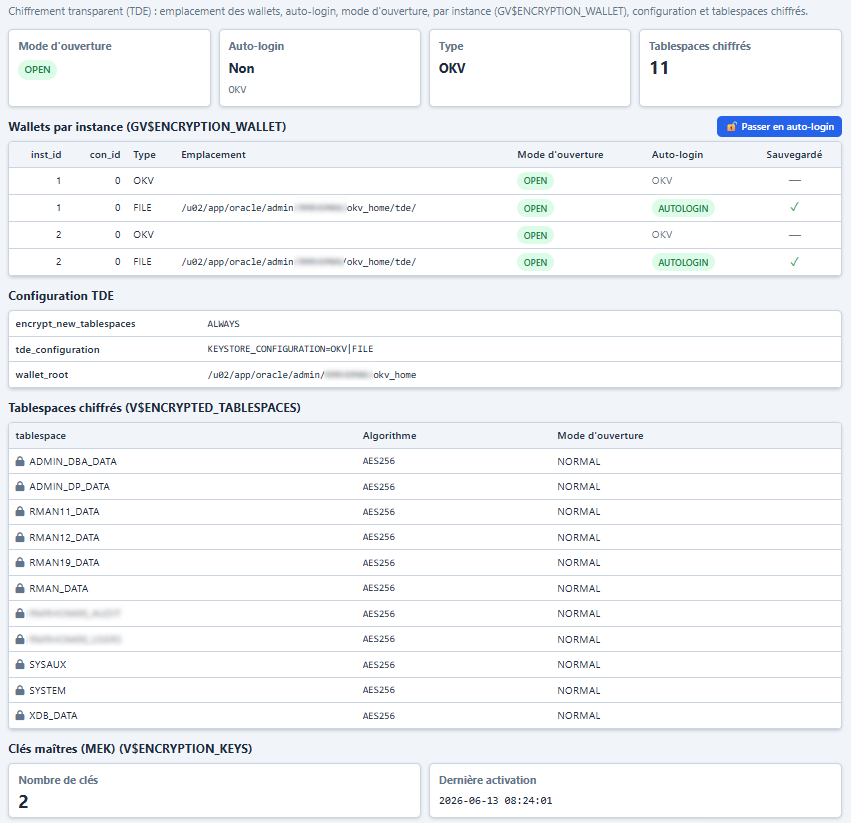
TDE / Wallets
The state of encryption at rest (Transparent Data Encryption).
- Wallets / keystores per instance (
GV$ENCRYPTION_WALLET): location (WRL_PARAMETER), open mode (OPEN / CLOSED / OPEN_NO_MASTER_KEY), auto-login (WALLET_TYPE: AUTOLOGIN / LOCAL_AUTOLOGIN / PASSWORD), type (FILE / HSM / OKV) and wallet backup. One row per instance on RAC. - TDE configuration (
V$PARAMETER):wallet_root,tde_configuration,encrypt_new_tablespaces(depending on the version). - Encrypted tablespaces (
V$ENCRYPTED_TABLESPACES): name, algorithm, status. - Master keys (
V$ENCRYPTION_KEYS): count and last activation (requires an elevated privilege, otherwise the section is unavailable).
Switch to auto-login (DBA right or site administrator only): a button opens a modal window asking for the keystore password and creates an auto-login keystore (cwallet.sso). See the administrator guide for the details and precautions.
8. Generated Oracle reports
These reports use the built-in Oracle packages to generate HTML. The result is displayed in an isolated iframe.
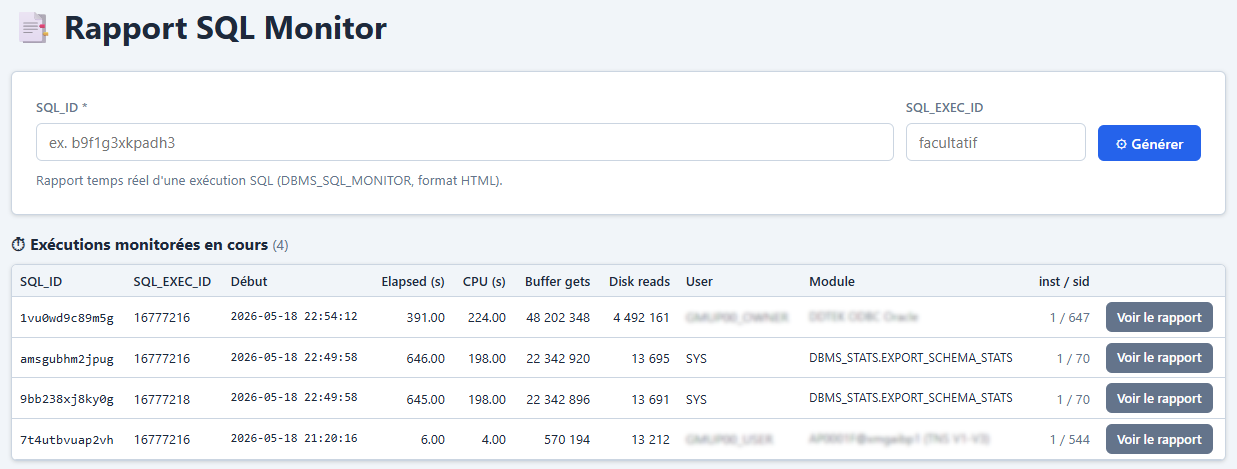
SQL Monitor
Licence required: Tuning Pack.
Generates the Real-Time SQL Monitoring report for a given SQL ID.
- Input: SQL ID (13 characters), SQL Exec ID (optional)
- Output: Oracle HTML report (parallelism, I/O, adaptive plans)
ASH report
Licence required: Diagnostic Pack.
Generates an ASH report (DBMS_WORKLOAD_REPOSITORY.ASH_REPORT_HTML) between two timestamps.
- Inputs: start date/time, end date/time
AWR report
Licence required: Diagnostic Pack.
Generates a Global AWR report (DBMS_WORKLOAD_REPOSITORY.AWR_GLOBAL_REPORT_HTML) between two snapshots.
- Inputs: start snapshot, end snapshot (drop-down lists fed from
DBA_HIST_SNAPSHOT, last 200 snapshots) - RAC-aware version: all instances are included
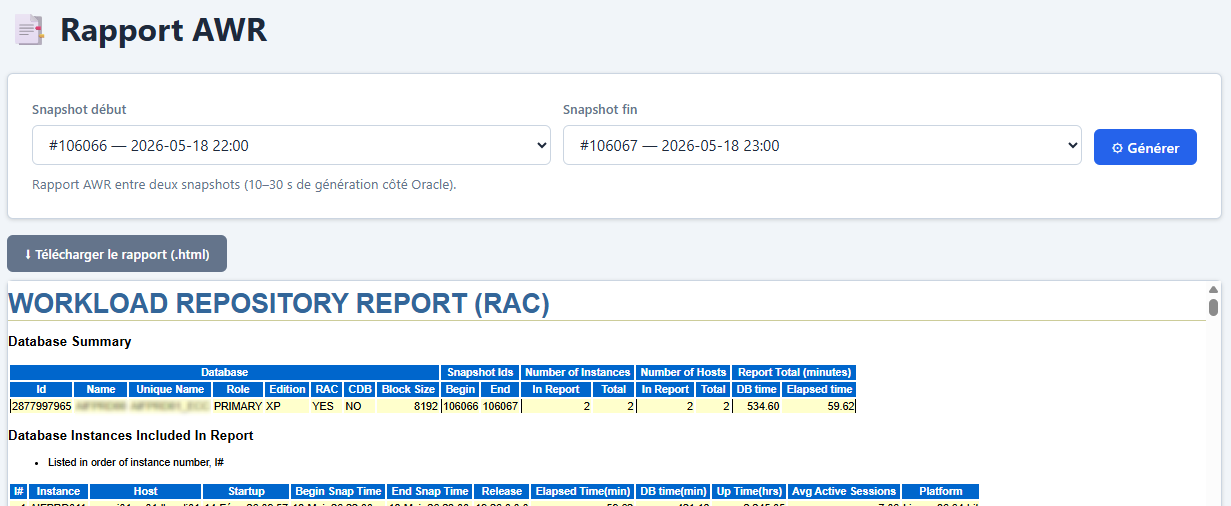
Each generated report can be downloaded as HTML via the dedicated button.
9. SQL and object detail
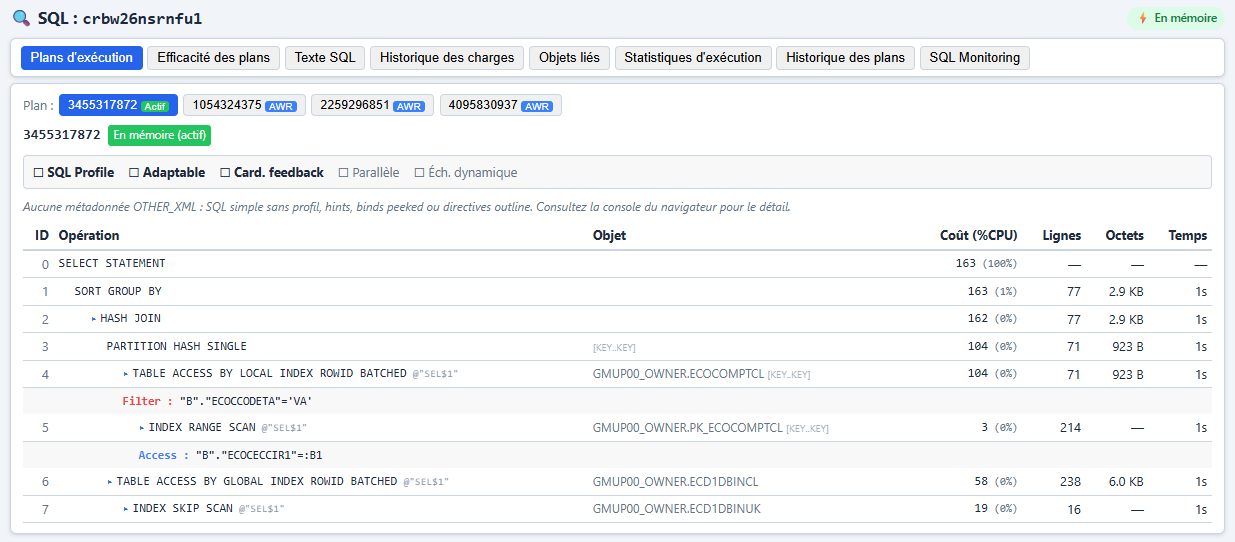
SQL detail
Reached by clicking a SQL ID in any report.
Sections:
- Execution plans: all child cursors, plan hash values, graphical tree rendering
- Plan details: operations, costs, cardinality, peeked bind values, outline hints, applied SQL profile
- Execution history (Diagnostic Pack): AWR statistics per plan hash — executions, elapsed time, CPU, buffer gets, disk reads
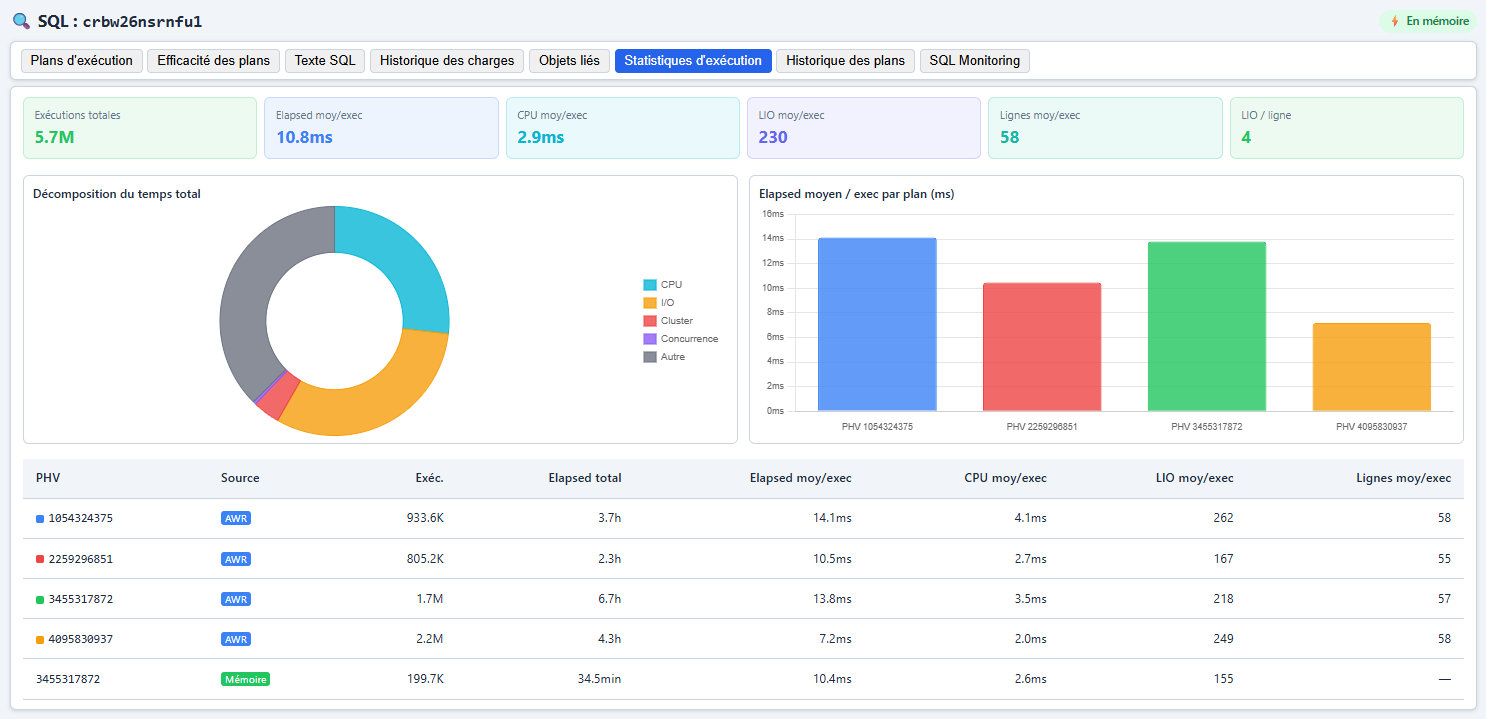
- Parse information: DB version, dynamic sampling, DOP, cardinality feedback
Sources and fallback. Each piece of information is looked up first in the dynamic views (GV$SQL, GV$SQL_PLAN — RAC-aware, falling back to the local V$ if needed): SQL text, plans, binds/outline (OTHER_XML), efficiency. If they are empty, the application switches to the history: AWR (DBA_HIST_*, Diagnostic Pack) or sw$bash_snapper (without a licence, or in forced test mode from the Developer module). Note: sw$bash_snapper provides only the efficiency and the load history — neither the SQL text nor the plans / OTHER_XML.
Object detail
Reached by clicking an object name in the reports.
- Object metadata (type, owner, size)
- Segment statistics (reads, writes, buffer activity)
- Index information (if a table)
- Partitioning details
10. SQL fix
DBA right required on the selected database.
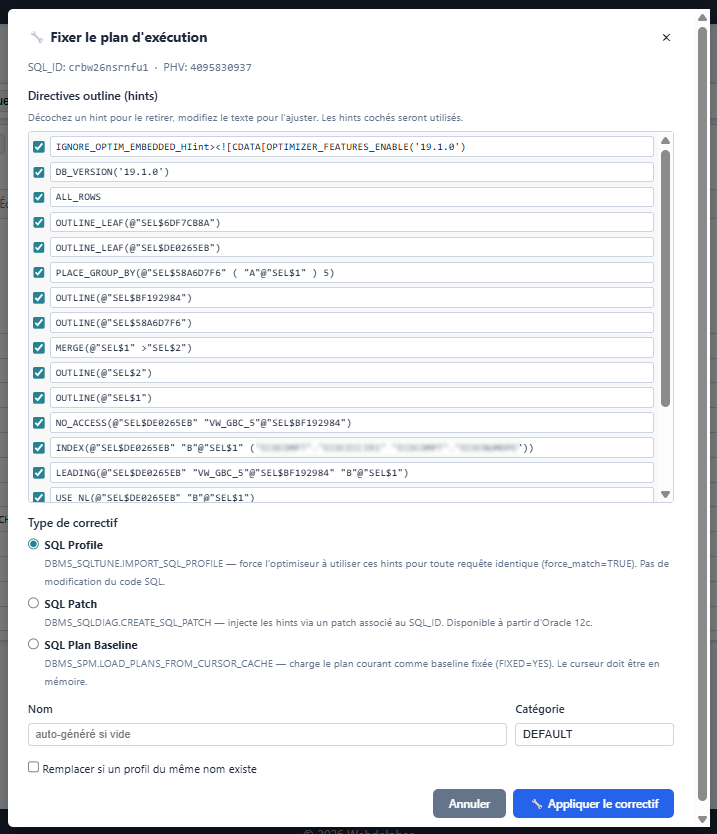
From a SQL ID’s detail page, three fix actions are available:
graph LR
 A[SQL detail] --> B[SQL Profile]
 A --> C[SQL Patch]
 A --> D[SQL Plan Baseline]
 B --> E[DBMS_SQLTUNE.\nIMPORT_SQL_PROFILE]
 C --> F[DBMS_SQLDIAG.\nCREATE_SQL_PATCH]
 D --> G[DBMS_SPM.\nLOAD_PLANS_FROM_CURSOR_CACHE]
SQL Profile
Freezes an execution plan through a set of hints (outline directives).
- Name: free (max 128 characters)
- Category: DEFAULT by default
- Force: replace if a profile with the same name already exists
- Package:
DBMS_SQLTUNE.IMPORT_SQL_PROFILE
SQL Patch (12c+)
Injects a block of hints on a SQL ID without changing the SQL code.
- SQL ID: pre-filled
- Hint: free text (e.g.
/*+ PARALLEL(4) */) - Name: free (max 128 characters)
- Package:
DBMS_SQLDIAG.CREATE_SQL_PATCH
SQL Plan Baseline
Loads a plan from the cursor cache and validates it as a baseline.
- SQL ID and Plan Hash Value: pre-filled
- Package:
DBMS_SPM.LOAD_PLANS_FROM_CURSOR_CACHE
Existing profiles and patches can be dropped from the same interface.
11. Frequently asked questions
I don’t see any database on the home page. No database is assigned to you, or the module is not active. Ask an oracle_admin to give you access to the relevant groups.
A historical report (ASH/AWR) stays empty or shows a licence warning. The database does not have the Diagnostic Pack. If sw$bash_snapper is installed on that database, the application automatically switches to the SW$BASH_* tables (see the Diagnostics section).
The “Kill Session” button or the SQL fix actions do not appear. These actions require the DBA right on the selected database (or the oracle_admin role).
The name of the selected database has disappeared from the navigation bar. The selection is tied to your session; reselect a database from the home page.
The “Restore points” and “Audit trail” entries do not appear in the Configuration menu. They are only visible with the DBA right on the selected database, or with the oracle_admin role.
I pinned a page as home, how do I go back to the default? Return to that page and click the floating ★ button at the bottom right again: the star empties and you return to the overview. You can also re-select “Overview” in My profile.
The “Set as home” button does not appear on some pages. Pages that depend on a parameter (SQL detail, object detail, ASH/AWR/SQL Monitor report forms) cannot serve as a home page: the button is therefore hidden there.
A “SQL Monitor” report refuses to generate. It requires the Tuning Pack on the target database.
After “Switch to auto-login”, the TDE wallet stays in password mode. This is normal: the auto-login keystore (cwallet.sso) is created but only becomes active at the next instance restart (or after closing / reopening the keystore). The dashboard may therefore still show PASSWORD until then.
On a running query, the binds (peeked values) are empty. The cursor has no OTHER_XML and the database has no Diagnostic Pack: Oracle then exposes these values nowhere. With the Diagnostic Pack, the application retrieves the historical OTHER_XML (AWR) of the same plan.