
Your Oracle databases. Under control.
No extra license required.
A lightweight web tool to monitor, diagnose and fix
your Oracle databases — even without the Diagnostic Pack.
[Illustration: Oracle dashboard — database grid by group/environment]
Available
The demonstration build of the Oracle module is ready to download.
It connects to your own Oracle databases and produces the same reports as the full
version — read-only: no action can be run against the database. Five databases at most.
Problems you face every day
🔴 “The database is slow, but nobody knows why”
A session blocking everyone else? A query eating all the CPU?
A batch running for hours with no progress indicator?
When an incident hits, every minute counts. Opening SQL*Plus,
querying V$ views, filtering manually — that’s too slow when
the pressure is on.
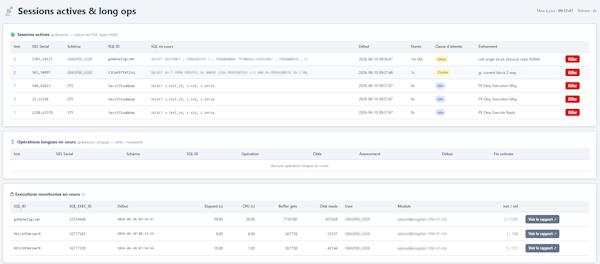
✅ Active sessions at a glance
- Auto-refresh every 10 seconds — see the database live
- Lock tree: who blocks whom, full chain visualized
- Long operations: real-time progress bar
- Kill session in one click (with confirmation and audit trail)
[Illustration: active sessions with locks and progress bar]
🔒 “We don’t have the Diagnostic Pack license”
AWR, ASH, activity heatmaps — all of that requires the
Diagnostic Pack. But your contract doesn’t include it.
Result: you’re flying blind, with no history.
Some teams set up homegrown crontabs, ancient Perl scripts,
or worse: they use AWR without a license and risk an Oracle audit.
✅ sw$bash_snapper: free, legal, built-in ASH
- 1-second sampling of active sessions, just like ASH
- Mini-AWR: hourly snapshots (sysstat, wait events, segments, top SQL)
- One-click install from the UI (dedicated schema, public synonyms)
- Transparent fallback: reports use native ASH when licensed, sw$bash_snapper otherwise
- No license required — pure PL/SQL, no third-party dependency
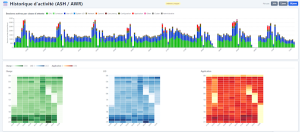
[Illustration: activity heatmaps powered by sw$bash_snapper]
📉 “It was fast yesterday, it’s slow today”
An execution plan change? An I/O spike?
A table whose statistics haven’t been recalculated?
Without the right tool, diagnosis takes hours — and the business is waiting.
✅ Guided, visual diagnostics
- Before/after comparison: wait class distribution across two time windows
- Minute-by-minute ASH detail with dynamic filtering (SQL ID, event, user)
- Health indicators: ratios (buffer cache, parse, library cache) with color-coded thresholds
- Memory advisors: Oracle recommendation charts (SGA, PGA, buffer cache)
- Stale statistics: detection + one-click gather
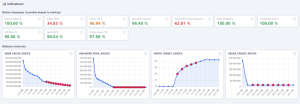
[Illustration: performance indicators with green/orange/red ratios]
🚨 “The query is slow but we can’t change the code”
Third-party application, ORM-generated code, deployment frozen
until the next release. The DBA needs to fix the execution plan
without touching the SQL.
Writing a SQL Profile by hand, finding the right hints,
navigating DBMS_SQLTUNE: it’s doable, but tedious.
✅ SQL fix in 3 clicks
- Full SQL ID detail: all plans, execution history, outline hints
- SQL Profile: pin a good plan via DBMS_SQLTUNE (name, category, force)
- SQL Patch: inject a hint without changing code (12c+)
- SQL Plan Baseline: load a validated plan from the cursor cache
- Drop existing profiles/patches from the same interface
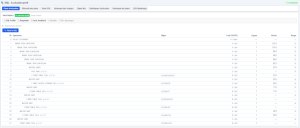
[Illustration: SQL ID detail with plans and fix buttons]
📚 “We have 50 databases and 10 people accessing them”
Every DBA has their own scripts, TNS aliases, and habits.
Developers ask for access but nobody knows who can see what anymore.
And Cloud databases (ExaCC, OCI) add wallet complexity on top.
✅ A single, secure entry point
- Centralized registry: standard + Cloud databases (wallet ZIP)
- Groups and environments: dev, test, staging, production, standby
- Granular access control: per user, AD group, or internal role
- Two permission levels: read-only (consultation) and DBA (actions)
- Authentication: local, LDAP/AD, OAuth/SSO
- Passwords encrypted at rest (XSalsa20-Poly1305)
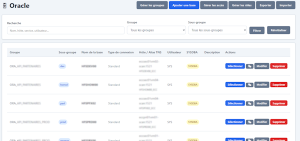
[Illustration: Oracle home — databases organized by group]
⏰ “We find out about problems when it’s too late”
Tablespace 95% full on a Friday evening. Redo logs too small,
switching 10 times an hour. RMAN backups failing for 3 days.
All of this is visible — when you know where to look.
✅ Dashboards and recommendations
- Tablespaces: used/free charts + resize recommendations
- Encrypted tablespaces (TDE) flagged with a lock icon
- Redo logs: switch frequency, size, inactive threads
- RMAN backups: last backup, history, recovery window
- Scheduler: running, scheduled, and failed jobs
- Alert log: latest entries with severity filter
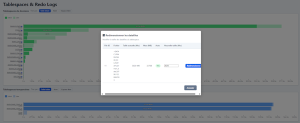
[Illustration: tablespaces with stacked bars and recommendations]
At a glance
| Problem | Solution |
|---|---|
| Slow database, no visibility | Real-time sessions + lock tree + kill session |
| No Diagnostic Pack license | sw$bash_snapper (ASH + mini-AWR, license-free) |
| Performance regression | Guided diagnostics, heatmaps, health indicators |
| Bad execution plan, code can’t be changed | SQL Profile / Patch / Baseline in 3 clicks |
| 50 databases, 10 users, no governance | Centralized registry + granular ACL + LDAP/SSO |
| Issues discovered too late | Tablespaces, redo, RMAN, scheduler, alert log |
Tech stack
PHP 8.2, no framework • SQLite (zero config) •
Apache 2.4 • Oracle Instant Client (OCI8)
No Node, no Docker, no external database to maintain.
A single directory to deploy.
Ready to take back control of your Oracle databases?
Deploy in 10 minutes. No license fee. No agent to install on Oracle servers.